Overview of The Pathway Tools Software
What is a Pathway/Genome Database and What is Pathway Tools?
A PGDB is a bioinformatics database (DB) that integrates genomic data with detailed functional annotations of the genome, such as descriptions of metabolic and signalling pathways, and of the regulatory network. The EcoCyc and HumanCyc DBs are PGDBs (see EcoCyc.org and HumanCyc.org).A PGDB serves as a central resource for capturing, integrating, and disseminating new scientific findings about the organism. It is a vehicle for tracking the evolving annotation of the genome, metabolic network, and genetic network of the organism, and for communicating that evolving knowledge through the Web. All genome annotations produced to date are incomplete, and contain significant numbers of errors. For organisms with active experimental communities, ongoing efforts are required to update those annotations to reflect new computational inferences, and new gene identifications and pathways reported in the experimental literature.
Pathway Tools supports creation, editing, querying, visualization, and analysis of PGDBs. The software also allows users to publish a PGDB on the Web for access by the scientific community.
For a comprehensive summary of the Pathway Tools capabilities click here.
PathoLogic: Creation of PGDBs
The PathoLogic component of Pathway Tools accepts an annotated genome in Genbank or GFF format as its input.
Its output is a new PGDB.
PathoLogic contains several computational inference algorithms:
- It predicts the metabolic reactions and pathways of an organism from its annotated genome.
- It predicts what genes code for missing enzymes within the predicted metabolic pathways, typically identifying on the order of 100 new gene functions in a microbial genome.
- It predicts the operons of a bacterium.
- It predicts transport reactions from transporter functional assignments
Pathway/Genome Navigator: Querying and Visualization of PGDBs
The Bioinformatics datatypes supported by the Pathway/Genome Navigator component of Pathway Tools are listed below. For each of the datatypes , Pathway Tools provides querying capabilities, visualization tools (such as for drawing pathways and genome maps), and interactive editing tools to allow users to update data (such as modifying a metabolic pathway or defining a new DNA binding site for a transcription factor). The visualization and querying capabilities allow PGDBs to be published on the Web, or to be accessed as a desktop application on the PC, Mac, and Linux platforms. The desktop and Web capabilities of the software overlap substantially, with some differences [details].- Metabolic and signalling pathways
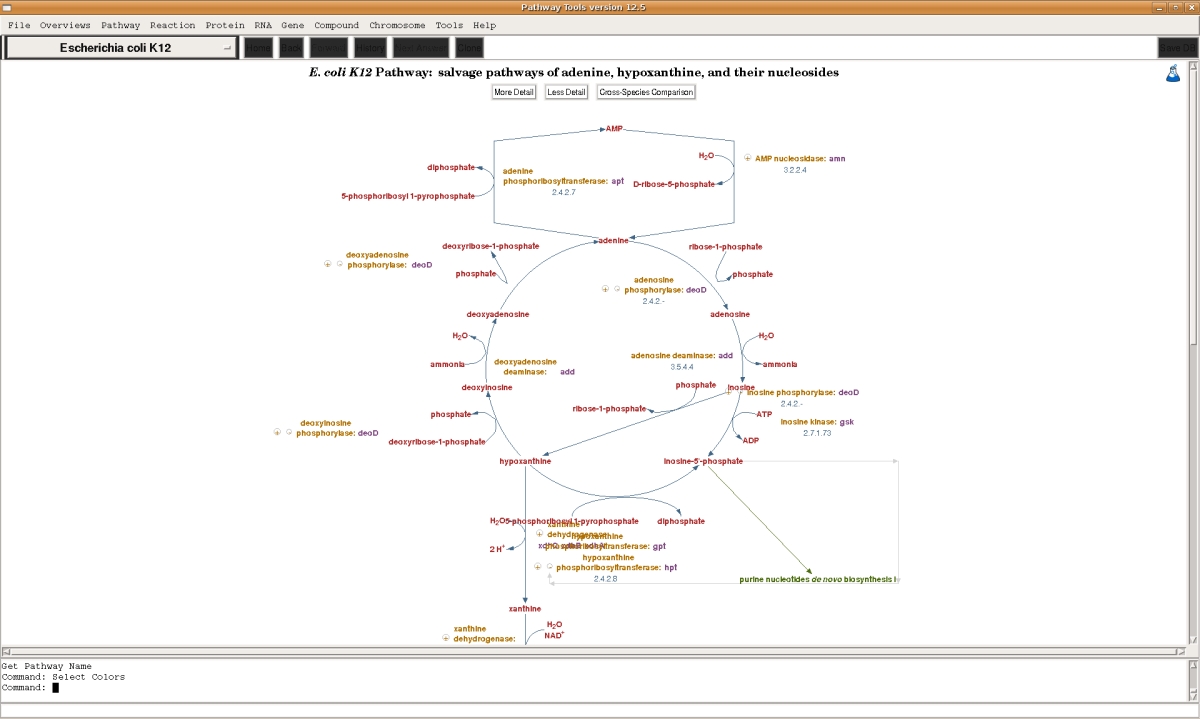 Full-sized image
- Metabolic enzymes, reactions, and small-molecule metabolites
- Transcription factors, operons, promoters, and transcription-factor
binding sites
- Transport proteins
- Genome maps for closed and unclosed genomes
 Full-sized image
- Individual growth media; growth observation studies under multiple growth conditions;
gene essentiality information
- Nucleic-acid sequences, amino-acid sequences, protein features, Gene Ontology annotations
Pathway/Genome Navigator: Analysis of Large-Scale Datasets
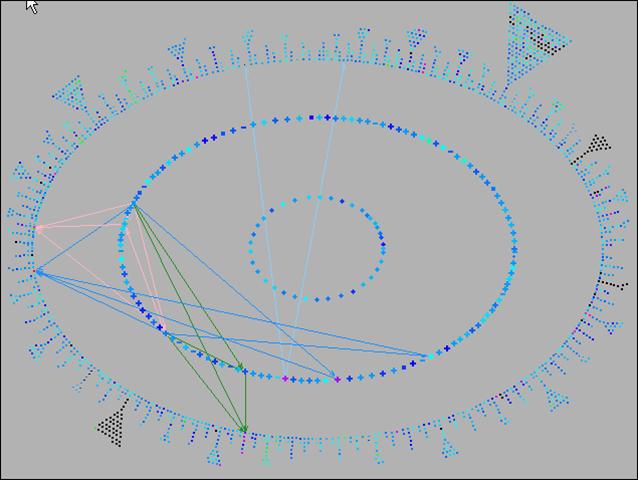
Pathway Tools can aid analyses of gene expression, protein expression, and metabolomics experiments through the Pathway Tools Omics Viewers, which allow omics datasets to be graphically painted onto three system-level diagrams: a diagram of the full metabolic network of the organism, a diagram of the full regulatory network of the organism, and a diagram of the full genome of the organism. The software can produce animated displays of a series of omics measurements. It can also depict data from multiple omics datatypes simultaneously, such as mixing gene-expression and metabolomics data on one diagram.
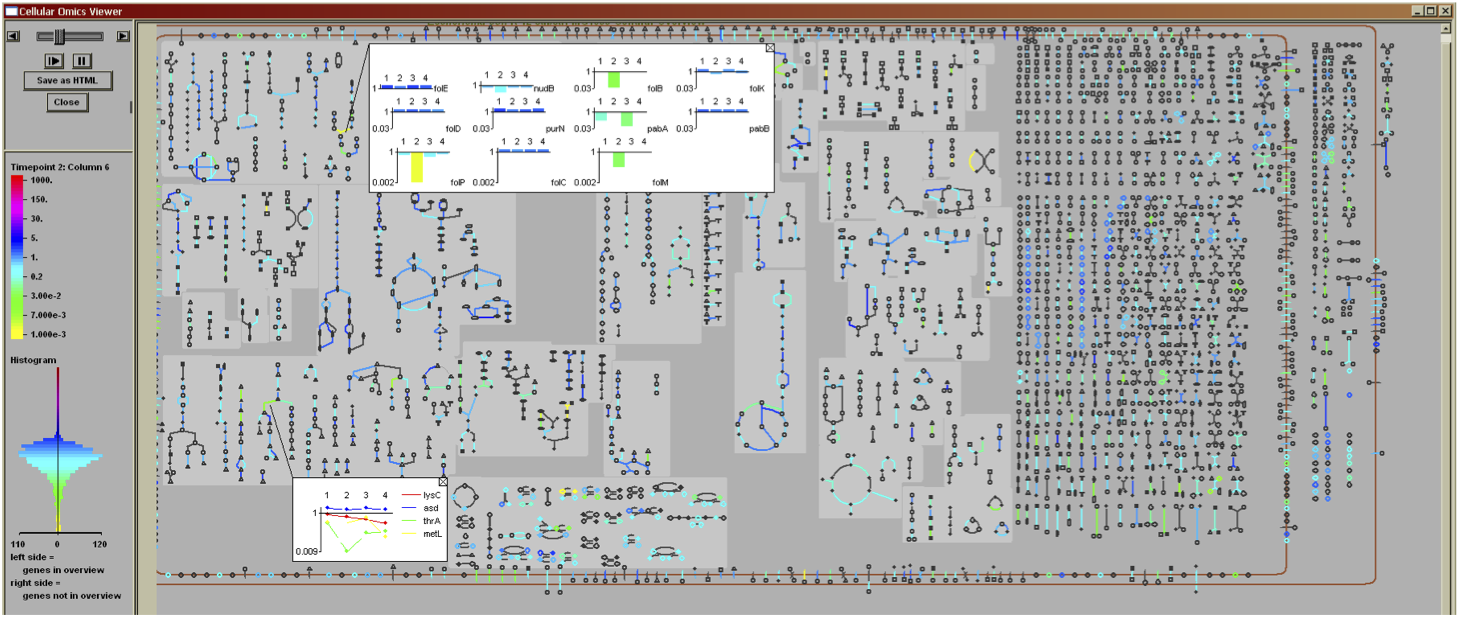
 Click on images to see full-size.
Other Pathway Tools capabilities for analysis of large-scale datasets include:
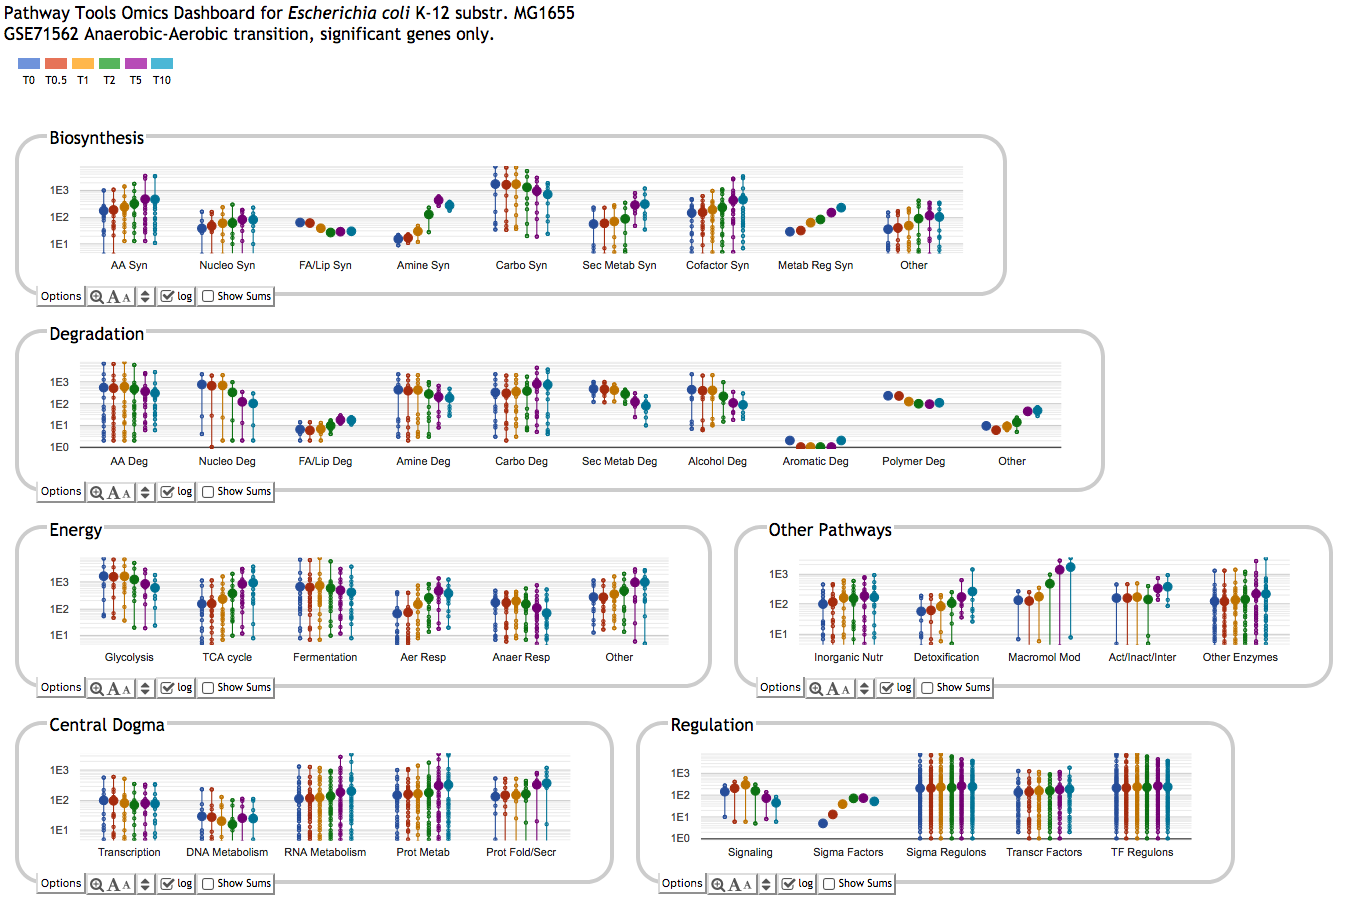
- The Omics Dashboard provides a system-oriented view of omics datasets,
enabling the user to view aggregate responses of cellular systems such as biosynthesis
and DNA repair, and responses and the pathway and gene levels:
- Enrichment analysis of gene sets and metabolite sets to pathways and Gene Ontology terms
- Graphing of omics data values for selected genes or metabolites, or for entire pathways
- Visualization of omics data on individual pathways and on multi-pathway diagrams called pathway collages
Other Pathway/Genome Navigator Operations
- Search for optimal sequences of reactions connecting two metabolites
- Find dead-end metabolites in metabolic networks
- Identify choke points (potential drug targets) in metabolic networks
- Comparative operations, including comparing the full metabolic networks of two or more organisms
- Automatic generation of posters depicting the genome and the complete metabolic network
- BLAST searches and sequence pattern searches against the genome
MetaFlux: Flux-Balance Analysis
The MetaFlux component of Pathway Tools supports development and execution of steady-state metabolic flux models using flux-balance analysis. Its gap filler module accelerates model development by suggesting improvements to a model such as addition of missing reactions. Reaction fluxes computed by MetaFlux can be painted onto the metabolic map diagram to speed understanding of modeling results. MetaFlux can simulate gene knock outs for selected genes, or for all genes in the organism.Pathway/Genome Editors: Curation Tools
Pathway Tools includes a suite of interactive editing tools for adding new information to a PGDB, and for updating existing information. Tools such as a pathway editor, gene editor, and enzyme editor speed database development.Other Aspects of Pathway Tools
Pathway Tools has a large user community, who have already successfully used the software to create database for many organisms.Extensive user documentation is available, as is an online information site at bioinformatics.ai.sri.com/ptools/.
The software is freely available to academic and government users. Users own and therefore control the PGDBs that they create.
How to Learn More
- Pathway Tools Demonstration videos
- Overview publication
- Pathway Tools and BioCyc Publications Page
- Visit the BioCyc Web site at http://BioCyc.org/ to browse through
several example PGDBs
- Visit and/or subscribe to the Pathway Tools blog to get all the latest news and tips
- The Pathway Tools software distribution includes extensive documentation